CIEL | Blog: Understanding GHG Emissions at Farm Level
James Husband, Head of Livestock Development, Map of Ag

The Map of Ag GHG ‘what if’ tool models and quantifies the effect of changes in herd performance on farm GHG emissions intensity. By tweaking the variables on the online tool, farmers and their advisors can see how different changes would impact their farm’s GHG emissions intensity.
As part of the CIEL Insights series, we’re shining a light on our amazing CIEL Members and the amazing work they are doing in their respective sectors. Our webinar which was held on 2 May, is accompanied by a number of of blogs and podcasts focused on highlighting a host of CIEL Members.
Map of Ag focuses is on creating the leading data permissioning platform so farms and industry can find, access, interoperate, re-use and above all control how and where their data is used. Underpinning an ecosystem of innovative data-driven solutions – proprietary and many more third-party – that drive productivity, efficiency, transparency and Net Zero. Thanks to James Husband for taking the time to write this blog explaining how the Map of Ag tool works and it’s use on-farm
The UK is a signatory to the 2015 (COP21) Paris agreement and hence has a legally binding commitment to reduce Green House Gas (GHG) emissions.
Agriculture accounts for approximately 10% of UK GHG emissions and the NFU has an aspiration for UK agriculture to be net zero by 2040. This is an extremely ambitious target which requires a deep understanding of where emissions arise and what factors influence them. Currently, this understanding does not exist widely enough at farm level to allow accurate targeting of efforts into GHG reductions for the biggest and easiest wins.
The Map of Ag GHG ‘what if’ tool models and quantifies the effect of changes in herd performance on farm GHG emissions intensity. It also calculates the feed protein efficiency and overall nitrogen efficiency. Protein and nitrogen efficiency are strongly correlated with reductions in GHG emissions; quantifying these is important to allow more specific focus areas of potential improvement. This process breaks down the overall emissions intensity figure into more easily understood parts.
The on-line tool shows the magnitude of reduction in GHG emissions associated with changes in several factors including culling rate, cow size, heifer and cow stocking rates, housing and slurry management, milk yield and quality, concentrate feed usage, age at first calving, and calving interval. By tweaking these variables, farmers and their advisors can see how different changes would impact their farm’s GHG emissions intensity.
Scenario Planning for Emissions Intensity
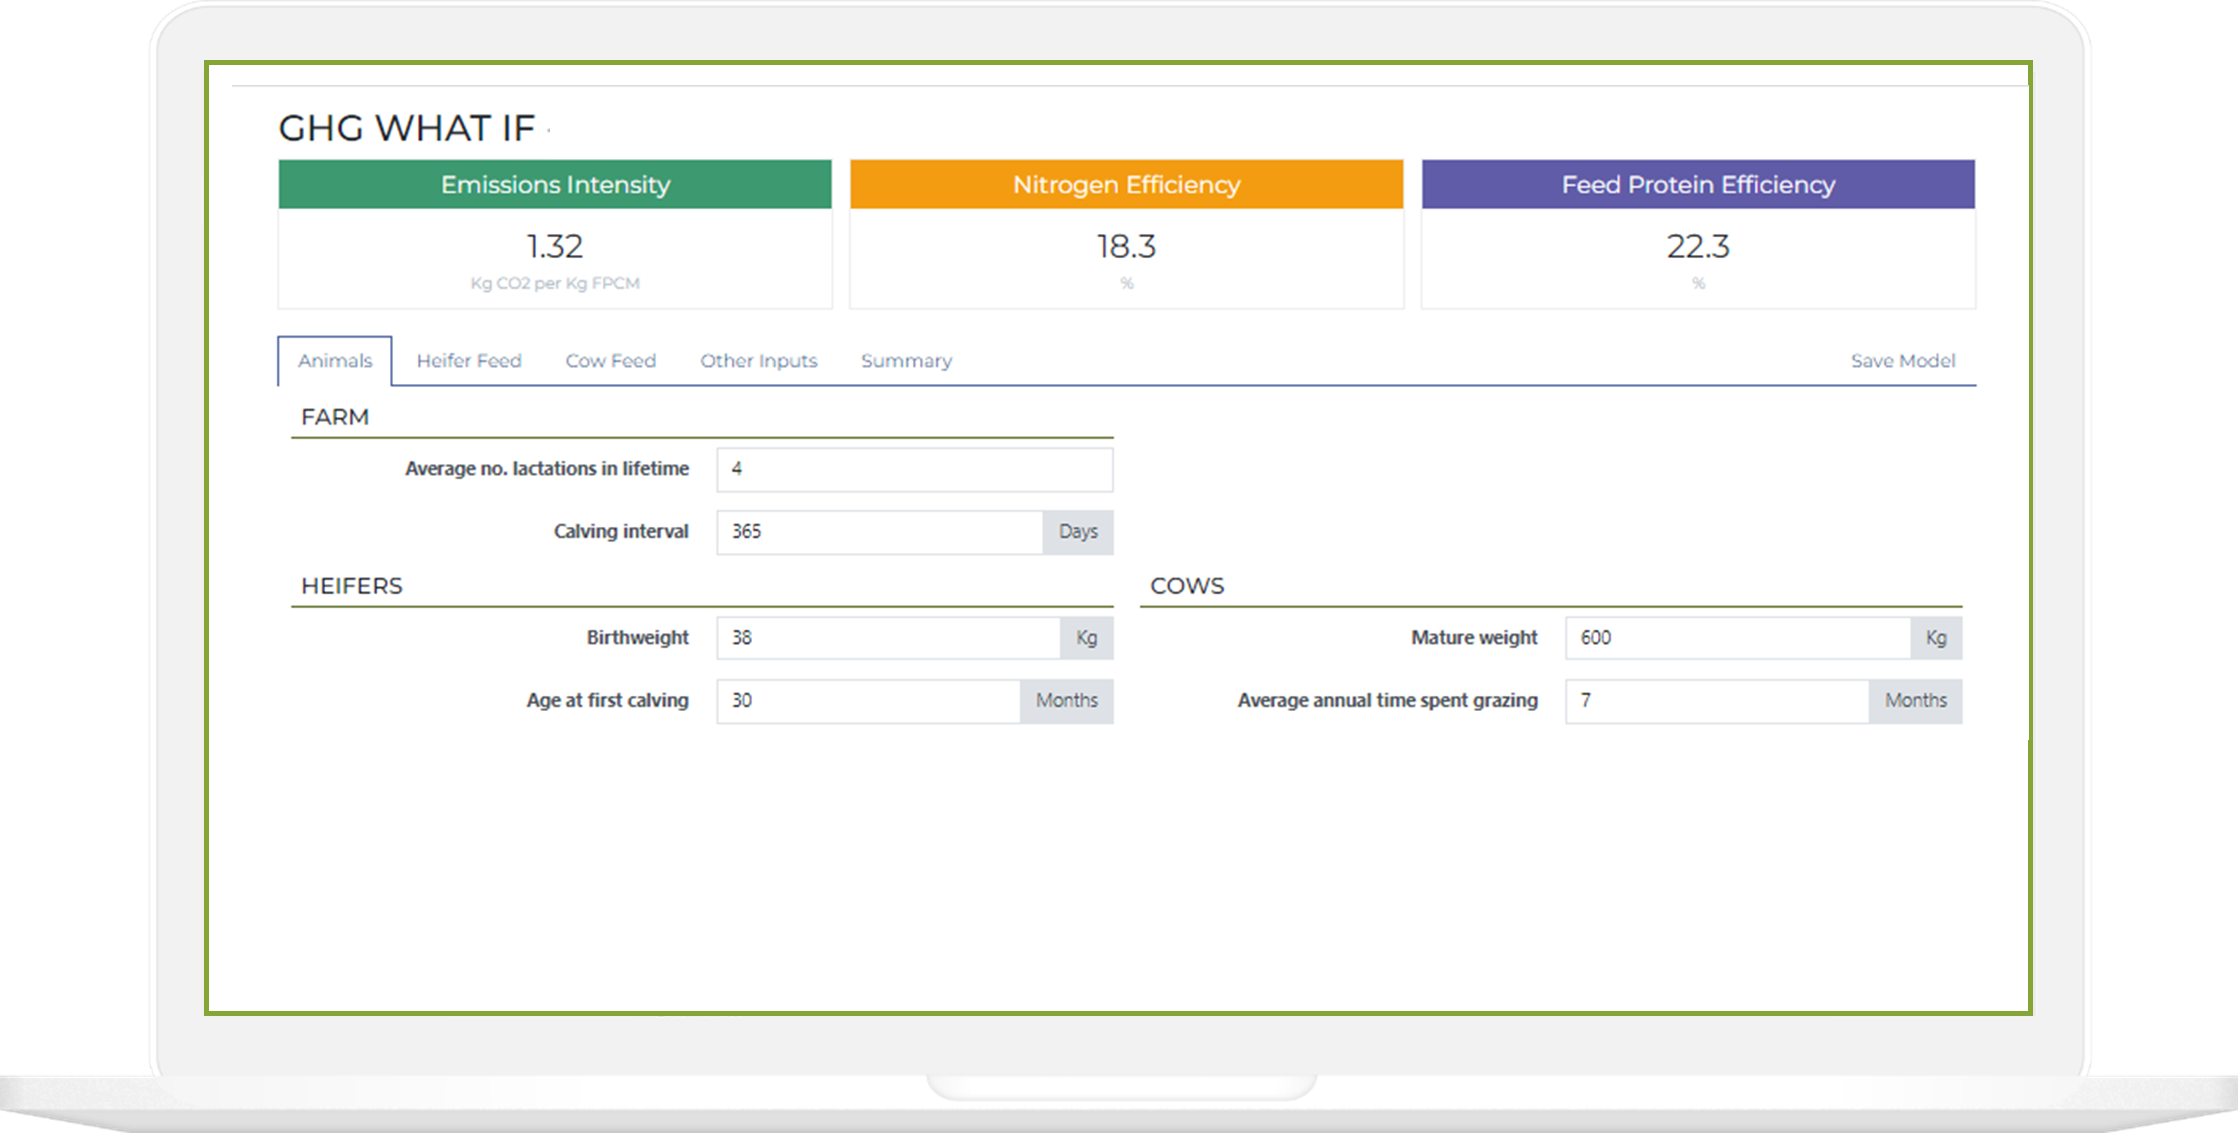
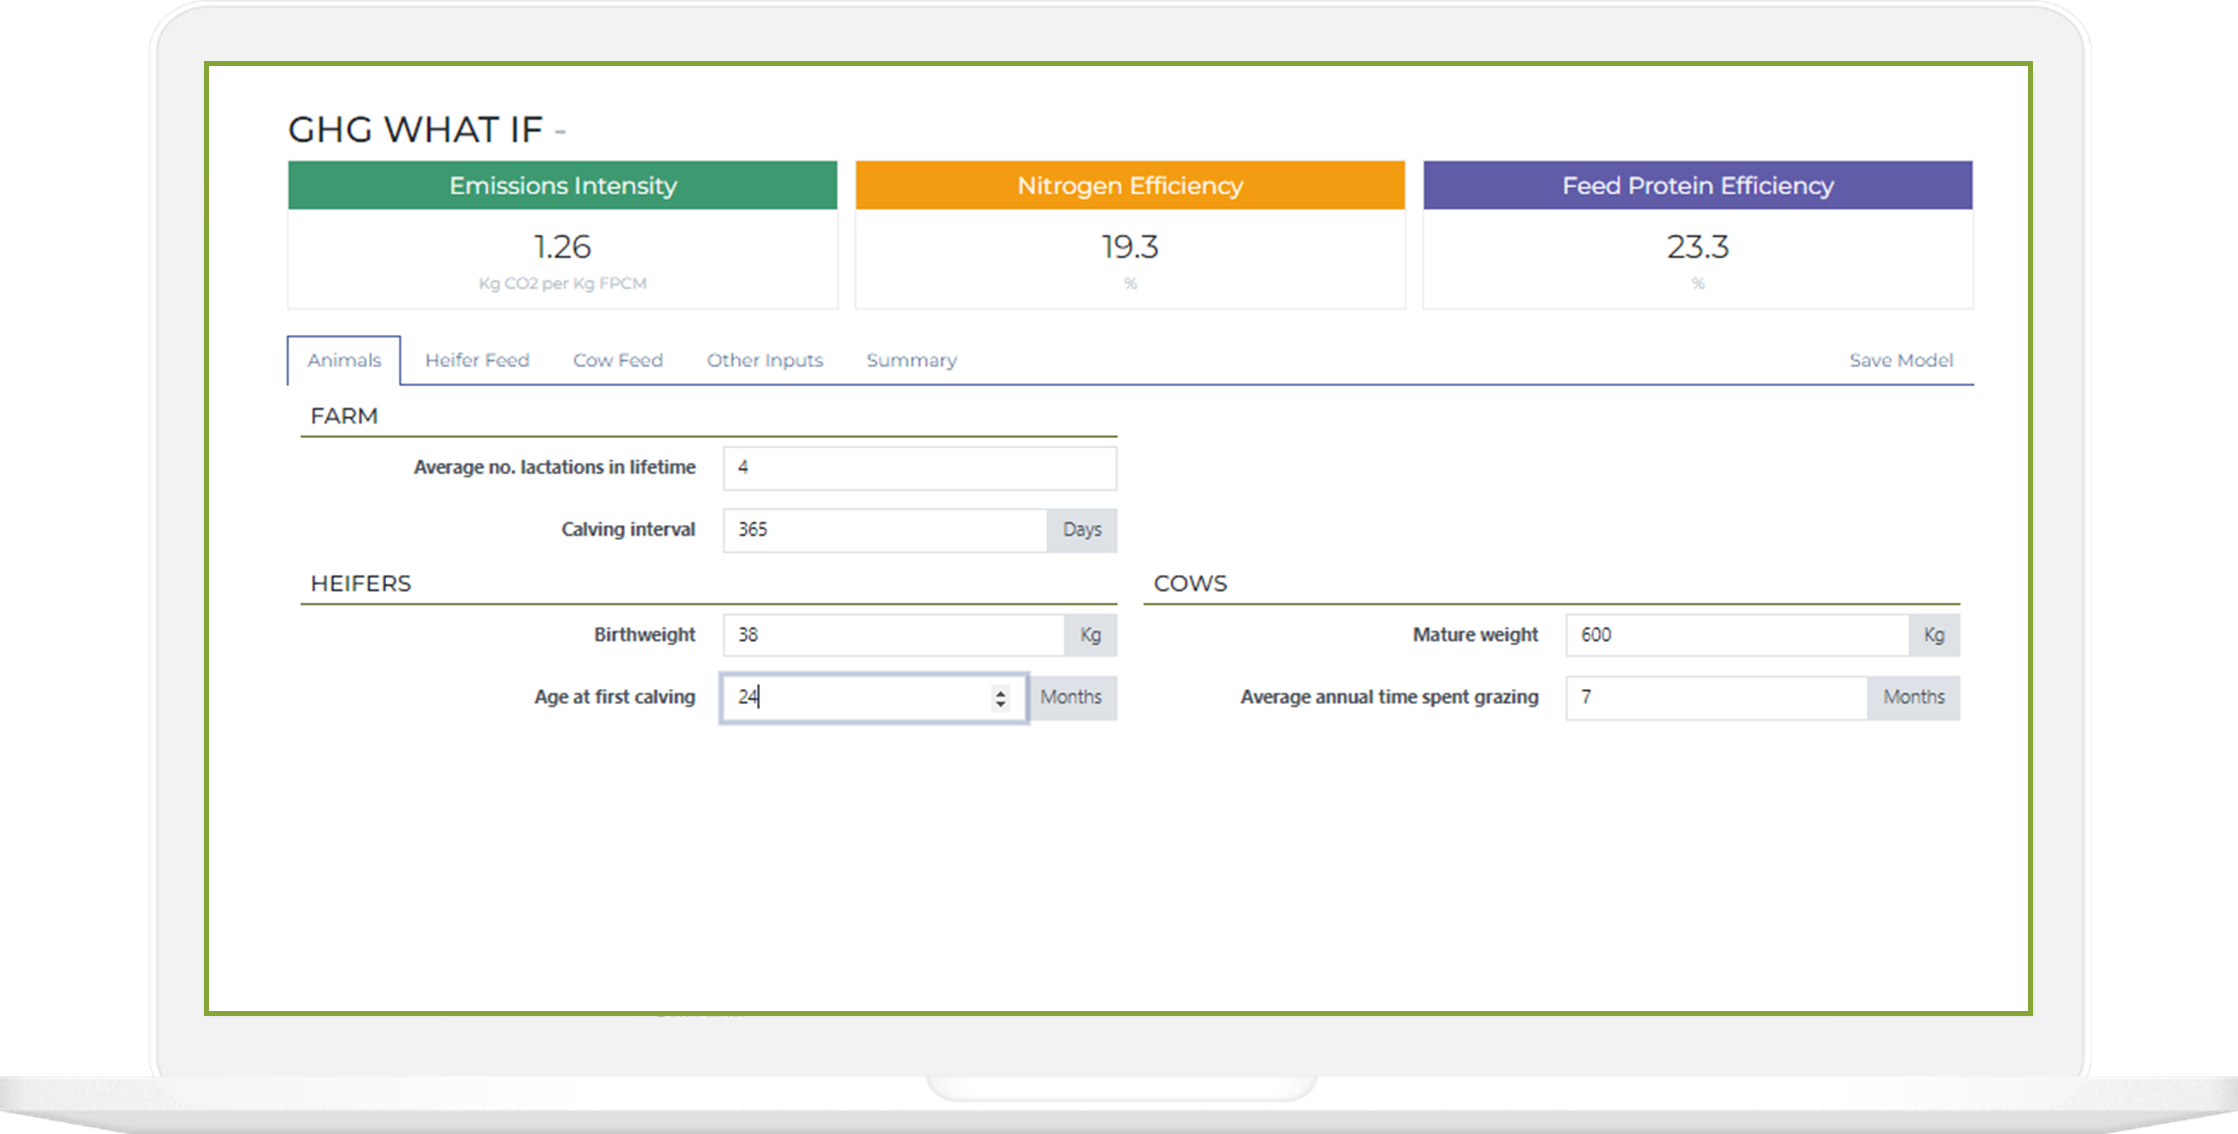
The on-screen example below show the effect of changing the age at first calving from 30 to 24 months. In the first scenario the emissions intensity is 1.32kg CO2e/kg of fat and protein corrected milk (FPCM).

If the same farm continues with the same level of performance in terms of yield, milk quality and milking cow feed usage, but the age at first calving reduces by 6 months to 24, the emissions intensity reduces by 0.06kg to 1.26, a reduction of 4.5%.

A reduction of overall emissions intensity of 4.5% may not sound a lot but there is a practical minimum level of emissions achievable, and emissions will never be zero (without carbon sequestration in soil and plants and possibly offsetting). The model can be used to identify this minimum level of achievable emissions under different production systems achieving the best possible levels of performance.
Let’s assume that the minimum currently achievable is 0.8kg CO2e/kg FPCM, in that case, the reduction of 0.06 seen above can be put into context in a more applicable way. The reduction from the current level of 1.32 in the example above to 0.8, is 0.52 and hence the effect of reducing the age at first calving by 6 months represents 0.06 out of a possible 0.52 which is 11.5% of what is achievable ie a significant proportion.
Protein Efficiency
Protein efficiency can be assessed using different combinations of forages and concentrate feeds and blends protein contents. In the scenario above, a change in the milking cow ration from 17% crude protein to 15.5% improves the protein efficiency from 23.3 to 24.1%. Similar ‘what if’ scenarios can be played out using all the variables to see what effects those changes have.
Putting This into Practice
By engaging with farmers and their advisors, the tool can help increase awareness around GHG emissions and the impact of different changes on farm emissions intensity. Even the most ‘carbon sceptic’ amongst us can see that improving resource efficiency makes farms more profitable and reduces their emissions at the same time.
The GHG ‘what-if’ tool can be used as an important resource for farmers and their advisors as they work towards reducing GHG emissions from agriculture. By identifying specific areas for improvement and quantifying the impact of different changes, the tool helps farmers to make informed decisions about how to reduce their farm’s emissions intensity. Ultimately, this will contribute to the UK’s broader goal of achieving net zero emissions by 2040, helping to mitigate the impacts of climate change and ensure a sustainable future for all.
To learn more about the ‘what if’ tool, explore how to model farms and apply different scenarios, learn how to calculate feed protein and nitrogen efficiency and gain a better understanding of the relationship between these factors and GHG emissions join the first of a series of webinars on 23 May.


